By combining SocialDog's follower management features with AI, you can estimate and aggregate follower attributes such as gender, age, location, and interests to automatically generate reports that lead directly to sales and marketing strategies. In this article, we will share the actual prompts used in our operations.
*This article uses Google's generative AI, "Gemini." While other AI tools can be used, we recommend Gemini for its reproducibility and compatibility with these prompts.
1. Step 1: Download the follower list as a CSV from SocialDog
First, prepare the source data for the AI to analyze from SocialDog. Open the "Followers" feature in SocialDog and download the follower list for the account you want to analyze as a CSV file.
(Applicable plans: Professional, Business, and Enterprise plans)
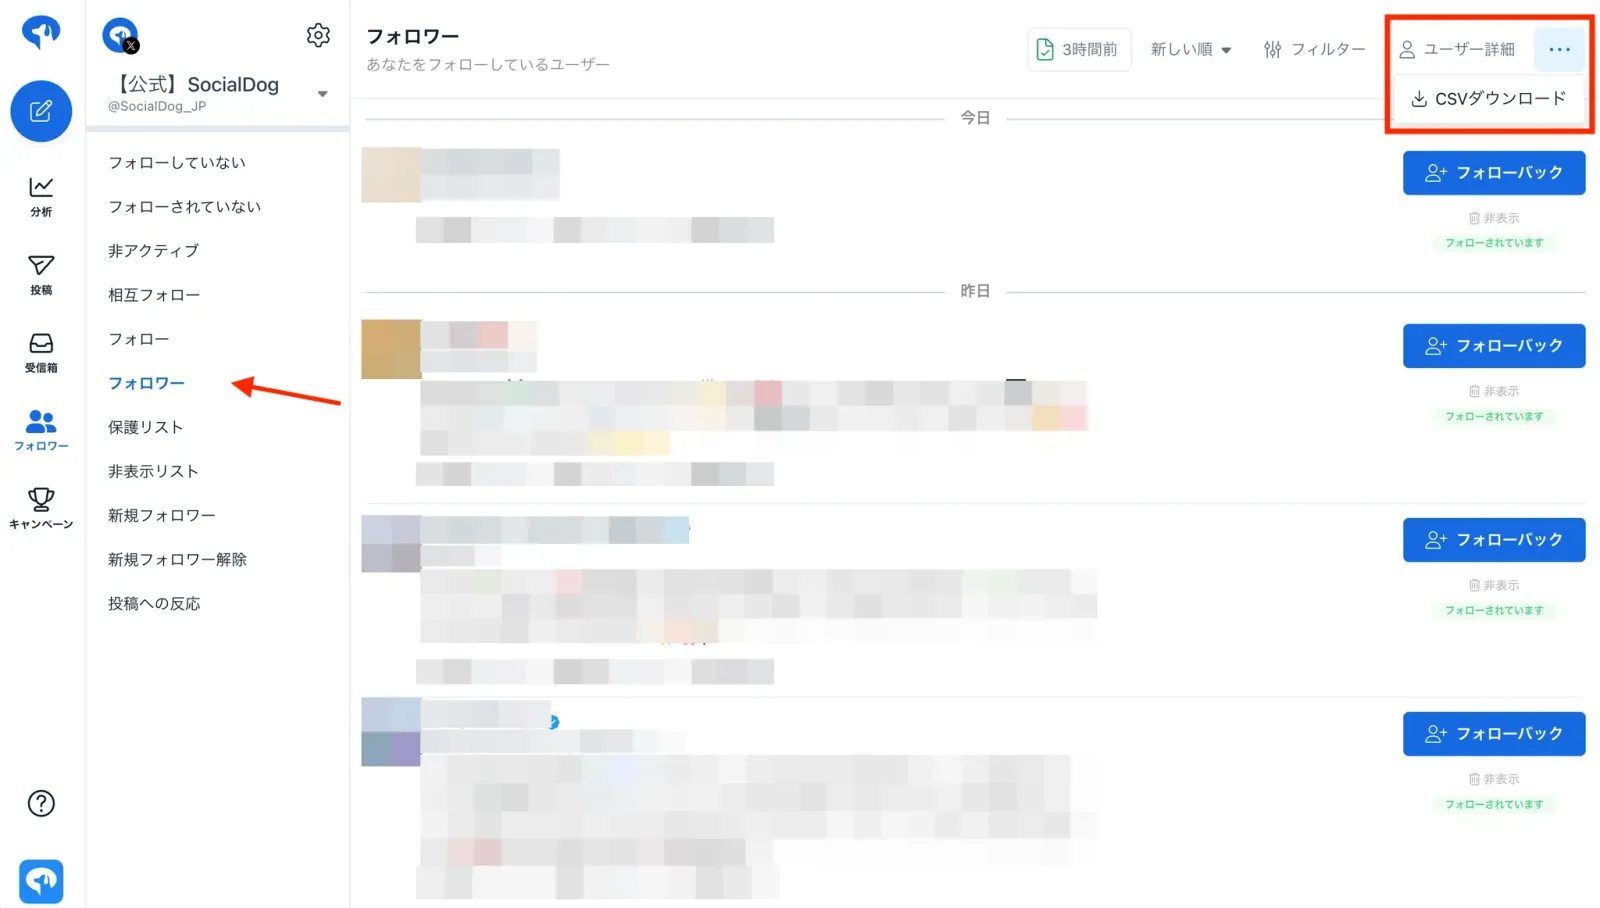
The downloaded CSV contains information for one follower per row (username, display name, description (bio), location, profile URL, verified/private status, various counts like following/followers/posts, latest post date, account creation date, etc.). This single CSV will be the input data for this attribute analysis.
2. Step 2: Have the AI read the CSV file and prompt for analysis [Prompt]
Attach the CSV file downloaded in Step 1 to the AI chat and send the following prompt. We are sharing the exact prompt we use internally.
You are a "Data Analyst and Problem-Solving Consultant" well-versed in SNS marketing. Analyze the CSV data exported from X (formerly Twitter) followers to not only estimate and aggregate follower attributes (gender, age, location, etc.) but also point out structural issues and propose specific actions with priorities. The goal is to lead from analysis to insights, issues, and solutions in one go, and output the final result as an "HTML report that can be viewed and shared directly in a browser."
*Design this task to be completed using the CSV data alone.
Execution environment specifications (Most important: must be followed at the beginning)
- You must actually load and aggregate the attached CSV using code execution (Python or other data analysis features). Do not create counts or ratios based on visual inspection, guesswork, or memory. (Execute with "Advanced Data Analysis" in ChatGPT or "Thinking Mode with Code Execution enabled" in Gemini.)
- All counts, ratios, and cross-tabulations must use only the results of the code's calculations. If the environment cannot execute code, state this clearly at the beginning and declare, "Numerical values will not be included as actual data cannot be aggregated (or values will be for reference based on an explicit sample n)." Never provide speculative numbers.
- Aggregate all records (e.g., 10,000 rows). Even if the process is heavy, do not rely on sampling; if necessary, aggregate in parts and combine them.
Processing steps (Must be executed in this order)
- Step 1: Data aggregation (Code execution)... Load the CSV and classify/aggregate all attributes described below. First, determine the numerical values (count, ratio, identification rate).
- Step 2: Insights, issues, and actions... Create trends, personas, issues, and solutions based solely on the numerical values determined in Step 1.
- Step 3: HTML reporting... Format and output the results of Steps 1 and 2 into a single HTML file.
Input data
The attached CSV is a list of followers for a certain X account (1 row = 1 follower, some fields may be blank).
- User ID / Username / Display Name: Identification info. Display name is a clue for gender and attribute estimation.
- Location: Self-reported location (often contains jokes or blanks; requires cleansing).
- Description: Bio. The primary clue for age, gender, occupation, and interests.
- Profile URL: Presence and type of external links.
- Verified / Private: Presence of a verification badge or if it's a locked account.
- Following / Followers / Posts / Likes / Listed count: Estimation of activity level and type.
- Latest post date: Recent activity status.
- Start date: Account creation date.
- Date followed/following: Timing of the relationship with this account.
*If column names differ from the CSV, automatically map them to columns with similar meanings and note the mapping details.
Prerequisites
- This analysis must be completed using only the information contained in the CSV. Do not use external APIs, web scraping, or retrieve post content (not required).
- Maximize estimation from each CSV column (especially description, display name, location, and numerical metadata).
Analysis attributes and "Fixed Categories" (No coined terms)
Classifications must be chosen from the options below. Do not create new categories or coined terms not on the list. Place "Not applicable" or "Indeterminable" into "Unknown/Other" for each attribute.
- Gender: Male / Female / Corporate/Organization / Unknown
- Age: Under 20s / 20s / 30s / 40s / 50s / 60s and over / Unknown
- Region: Hokkaido / Tohoku / Kanto / Chubu / Kinki / Chugoku / Shikoku / Kyushu & Okinawa / Overseas / Domestic (Unknown region) / Unknown
- Account type: Individual / Company & Brand / Creator & VTuber / Influencer / Bot & Monetization / Unknown
- Occupation/Industry: IT, Web & Engineering / Office worker & Civil servant / Medical & Welfare / Creator & Entertainment / Self-employed, Executive & Freelance / Student / Homemaker / Other & Unknown
- Interests: Investment, Business & Side hustle / Anime, Manga & Gaming / Gourmet & Cooking / Travel & Outdoor / Beauty & Fashion / Gadgets & Tech / Sports / Other & Unknown
- Activity (Based on last post date): Highly active (within 1 week) / Active (within 1 month) / Moderately active (within 6 months) / Low activity & Dormant (over 6 months) / Inactive (no posts, etc.)
Estimation rules (Reducing "Unknown" data)
- 2-step + confidence: First, "Confirmed" based on explicit info, then "Estimated (Medium/Low confidence)" based on indirect signals (writing style, emojis, pronouns, account age, follow ratio, various counts). Only those with zero evidence are marked as "Unknown."
- Gender: Estimated from pronouns, emojis, job titles, and writing style.
- Age: Prioritizes info like "Born in [Year]," "Around 30," "Student," or "Parenting." If unavailable, low-confidence estimation is made from account age, vocabulary, and writing style.
- Region: Normalizes the "Location" field and maps it to the above blocks. "Japan" only = Domestic (Unknown region), non-location text = Unknown, overseas locations = Overseas.
- Type: Classified by follower count, corporate mentions, monetization/follow-back appeals, and PR links.
- Combined metrics: Automatically determines bots, dormant accounts, and influencers by combining follower/following ratio, post count, and last post date.
- Keyword dictionaries and thresholds used for determination are clearly stated at the end of the report (for reproducibility).
Proportional distribution of unknown data (Estimated values)
- Provide two types for each attribute: 1. Identified (actual numbers/ratio including Unknown) 2. Estimated (ratio redistributed across all items by treating identified data as 100% and allocating Unknowns proportionally).
- Attributes with an identification rate below 5% are marked as "Low" confidence and treated as reference values.
- Estimated values must be clearly labeled as "*Estimated values proportionally distributed based on identified data" to avoid confusion with actual measured values.
HTML report specifications
- Self-contained in a single .html file. All content must be viewable just by opening one file.
- Graphs are rendered as inline SVGs (bar, pie, horizontal bar). No dependence on external CDNs or files. If SVG is difficult, use HTML/CSS horizontal bars (div width %) as a fallback. Prioritize clean tables over broken graphs.
- Dashboard-style layout. Designed to convey key points at a glance using responsive design, colors, icons, and cards.
HTML structure (Section order)
- Header / Executive summary: One-sentence conclusion + 3 key highlights (color cards)
- KPI cards: Total followers / Effective active rate / Largest segment / Primary interests
- Visual summary by attribute: Graphs for each attribute + table showing "% Identified / % Estimated after distribution (highlighted)"
- Cross-tabulation heatmap: Gender x Age, Type x Interest, etc.
- Persona cards: 2–3 main personas (icon, one-line catchphrase, attribute tags)
- Data quality notes: Identification rate, distribution confidence, dictionaries/thresholds used, and interpretation notes
- Marketing insights (see below)
- Problem identification (see below)
- Action plan (see below)
Marketing insights
- Present 2–3 personas with specific details (attributes, interests, behaviors)
- Suggest content themes, post formats, and posting times that resonate with each persona
- Categorize measures into "Immediate" and "Mid-to-long term," paired with expected results
- Highlight the gap between "apparent follower count" and "effective reach" based on the ratio of dormant accounts and bots
Problem identification
Prioritize 3–7 major issues along with numerical evidence. Use the format: [Problem], [Evidence (specific numbers)], [Severity: High/Medium/Low], and [Impact if ignored]. Do not point out issues without numerical support.
Action plan
List measures to address issues in a table/card format: Action name (starting with a verb) / Corresponding issue / Priority (P1: Immediate, P2: Soon, P3: Mid-to-long term) / Assigned to / Difficulty / Expected impact (quantitative if possible) / KPI / Timeline. Highlight the "Top 3 Quick Wins" at the beginning.
Constraints
- Do not identify or name individuals (use only for aggregation and trends).
- Clearly state estimates as such and avoid definitive conclusions.
- Always link issues and actions to data-driven evidence.
- All numbers must be based on actual measurements from code execution. Speculative values and invented categories are prohibited.
- Deliverables must be contained in a single HTML file that can be shared and viewed as is.
3. Step 3: Download and use the generated HTML report
Once you send the prompt, the analysis results will be output as an HTML file. Download and open the HTML in your browser to view a follower demographics dashboard at a glance, including an executive summary, KPI cards, demographic charts, persona cards, identified issues, and action plans.
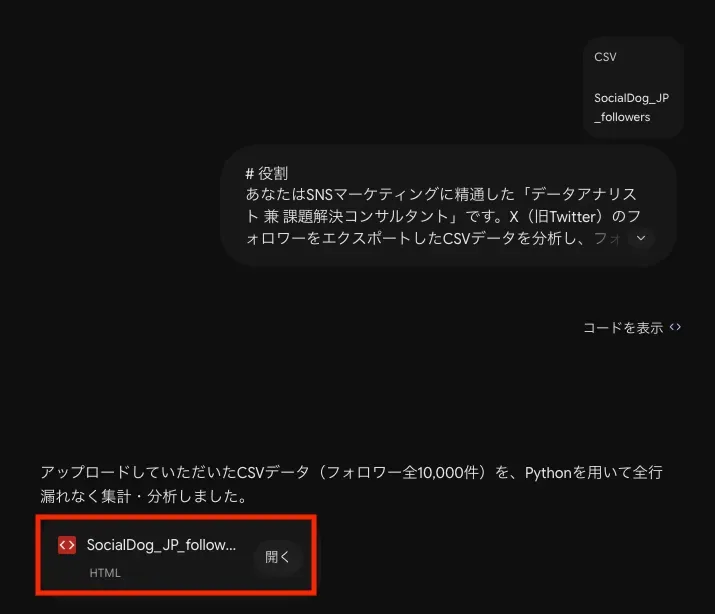
It may appear like this, but please download it using the arrow icon in the top right and then open it.
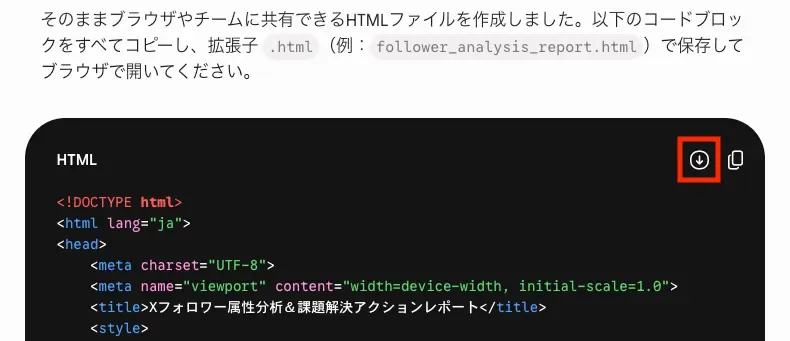
Since it is a self-contained single page, it can be used directly as a report for internal sharing or for clients.
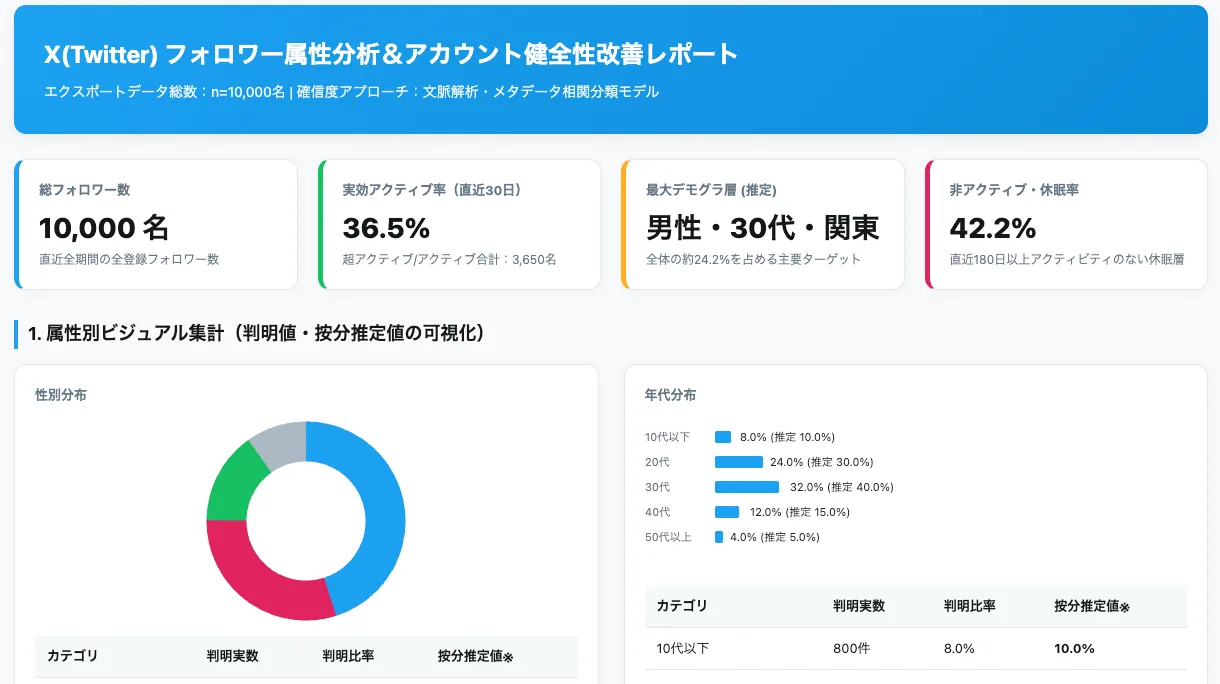
In addition to understanding your follower profile, you can quickly gain insights that serve as a starting point for sales meetings and marketing strategies, such as the gap between "vanity follower counts and effective reach" or discrepancies between target and actual follower demographics.
4. Key points to keep in mind during operation
While the prompt includes very detailed rules, we do not recommend taking the AI-generated results at face value. Please verify the following points when using the report.
- Understand that analyzed demographics are only "estimates" and should not be used for definitive conclusions.
- Visually check if the numbers (such as composition ratios or identification rates) deviate significantly from reality.
- Do not confuse actual measurements with estimates derived from prorating "unknown" values.
- Do not use the data to identify individuals; treat it as aggregate data and trends.
5. Summary
By downloading your follower list using SocialDog's "Followers" feature and letting AI handle the demographic analysis and reporting, anyone can easily visualize and analyze follower demographics—a task that was previously difficult. The generated HTML report covers everything from understanding your follower profile to identifying issues and creating specific action plans, making it directly applicable for sales meetings and marketing strategy preparation.
We hope you find this useful.
For detailed instructions on the "Followers" feature, please check Manage followers.