Even if you find mentions of your company, it's hard to tell at a glance whether they reached many people or were barely seen. A high volume of mentions doesn't always mean they are actually spreading.
By combining SocialDog's "Conversation trends" feature with AI, you can automatically generate reports that aggregate and visualize which mentions reached how many people based on posts about your company and their performance data (impressions, engagement, likes, reposts, etc.). In this article, we'll share two prompts we use in our actual operations.
*This article uses Anthropic's generative AI, Claude. While other AI tools can be used, we recommend Claude for its reproducibility and compatibility with these prompts.
[Introduction] Two types of review analysis with SocialDog × AI
There are two ways to analyze mentions using SocialDog data, depending on your goals. This article covers Pattern B (Conversation trends).
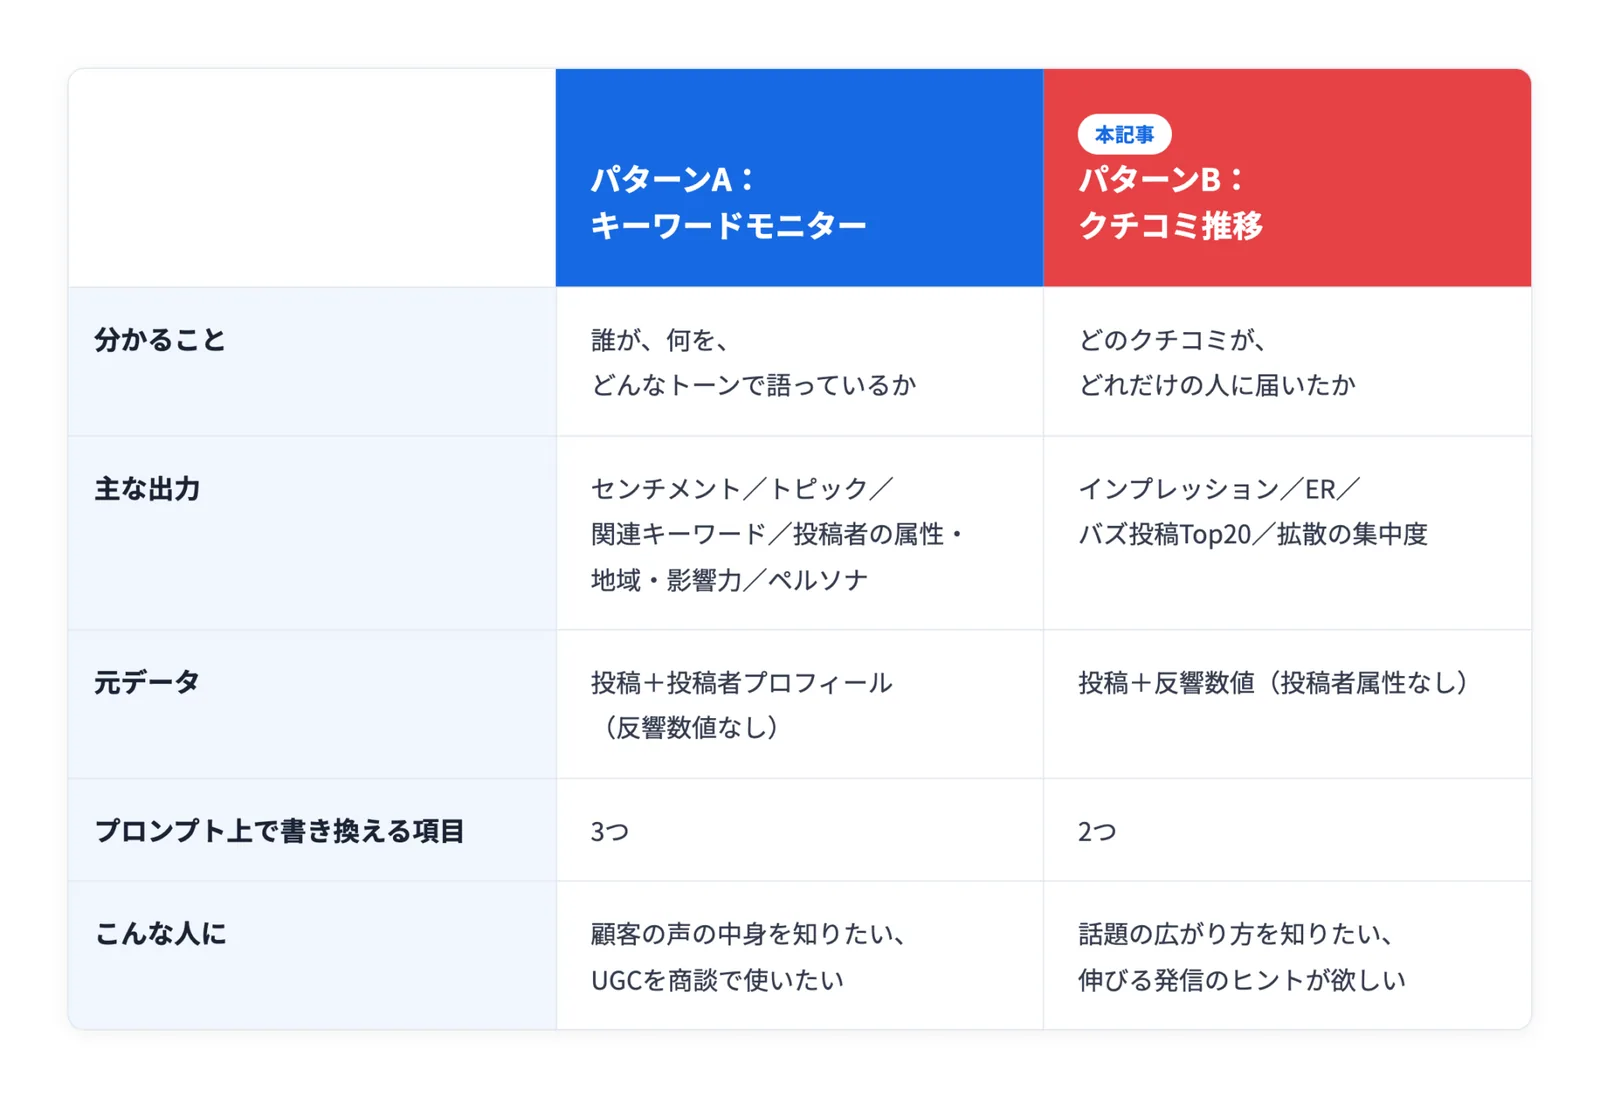
If you want to know the content of the mentions (who is saying what) about your company, please see article ①, "Analyze your company's mentions with SocialDog × AI (Who & what they're saying)".
1. Step 1: Download conversation trends data as a CSV from SocialDog
First, prepare the source data for the AI to analyze from SocialDog. Open the "Conversation trends" feature in SocialDog and specify the following conditions from the advanced search in the upper right. (Available on: Business and Enterprise plans)
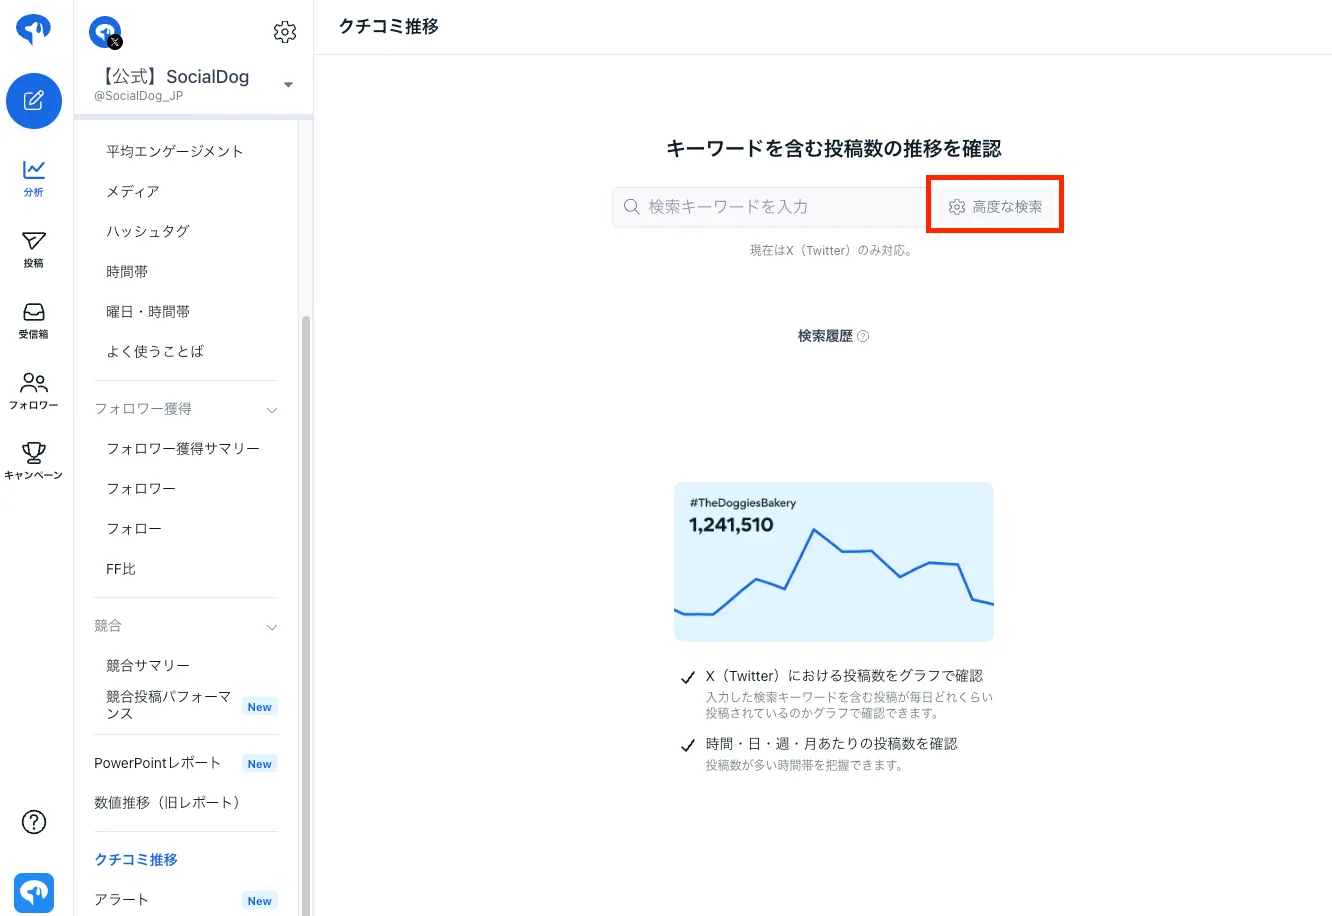
- Set your company name, brand name, product name, etc., as search keywords
- Set the search option filter to "Exclude reposts (retweets)"
- Exclude your own posts if necessary (Format: Brand name -from:YourAccount / Example: SocialDog -from:SocialDog_JP)
Next, specify the period you want to retrieve using the date picker in the upper right. Once the conditions are set, download the post list as a CSV file. If the number of results exceeds 500, please download multiple times by dividing the period.
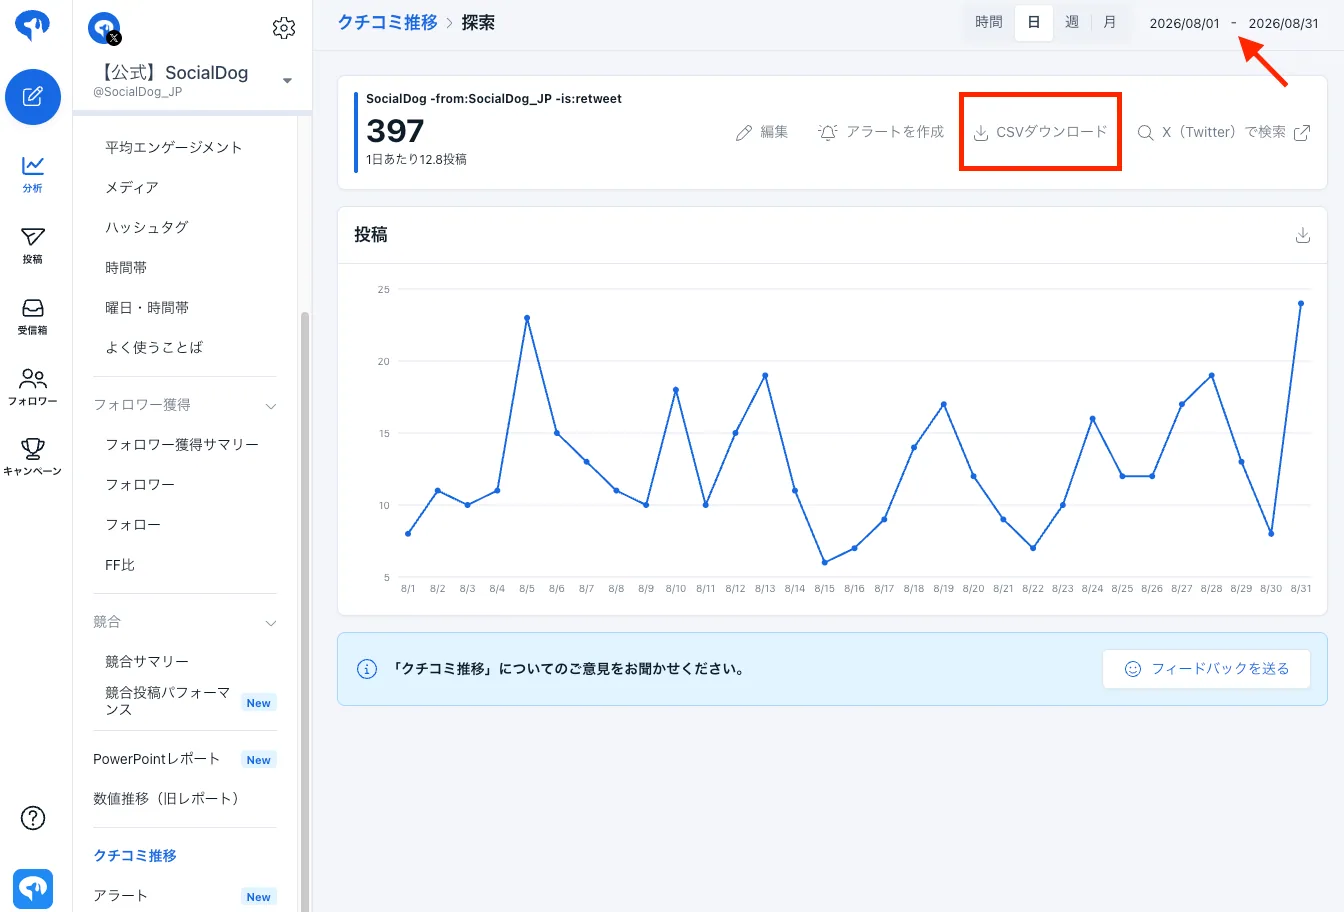
⚠️ Do not rename the downloaded CSV file; provide it to the AI as is. The filename contains the keywords, operators, and period used for the search, which the AI uses to understand the search criteria and reflect them in the analysis premises.
2. Step 2: Upload the CSV file and Prompt 1 to the AI for analysis [Prompt]
Attach the CSV file downloaded in Step 1 to Claude and send Prompt 1 (Data Aggregation & Storage version).
Only two items at the beginning need to be changed
This prompt is not exclusive to SocialDog; it's a general-purpose version that can be used for mentions of any brand, product, or store. Simply change the following two items in the "Analysis Target Settings" at the beginning of the prompt.
- Target brand name (e.g., SocialDog)
- Industry/Category (A brief description of what you sell / Example: SNS management tool, cafe, cosmetics brand)
Optional fields such as spelling variations or specific points of concern can be left blank. For blank items, the AI will infer and fill them in based on the target brand name and industry, displaying the actual values used in the "Analysis Premises" section of the report. If the results differ from your intention, fill in only those items in the optional fields and run it again.
Show full prompt (Click to expand/collapse)
# 役割
あなたはSNSマーケティングに精通した「ソーシャルリスニングアナリスト」です。SocialDogのクチコミ推移で取得したCSV(自社に関する投稿とその反響データ)を分析し、「どのクチコミが、どれだけの人に、どう届いたか」を集計・分類し、深刻度付きの問題点とアクション案まで含めて、後続の資料化ステップでそのまま使える「構造化データ(JSONファイル、必要に応じて補助CSV)」として保存してください。
**この工程の成果物はJSON/CSVの構造化データのみです。PPTX・HTML等の見た目のレポートは一切作成しません。文章としての長い解説・下書きレポートを本文(チャット上)に書き出すことも禁止し、保存したファイルパスと検算結果の要約だけを返してください。**
※ このタスクはCSVデータ単体で完結させること。

# 分析対象の設定(ここだけ書き換える)
**必須は2つだけ。残りは空欄でよい**(空欄の項目はAIが推定して補う)。本文中の「対象ブランド」はここで指定した名称を指す。

【必須】
- 対象ブランド名:(記入例:SocialDog)
- 業種・カテゴリ(何を売っているかを一言で):(記入例:SNS運用管理ツール、カフェ、化粧品ブランド)

【任意・空欄でよい】
- 表記ゆれ:(記入例:SocialDog / socialdog / ソーシャルドッグ)
- 特に注意してほしいこと(自由記述):(記入例:キャンペーン告知が多い時期)

**(記入例:…)は書き方の見本であり、分析対象ではない。記入例の値をそのまま使ってはならない。必須の2項目が空欄のまま実行された場合は、分析を始める前に何を分析すればよいか利用者に尋ねる。**

# 空欄の項目の埋め方(AIが行う)
空欄の項目は、対象ブランド名と業種から**AIが推定して補う**。補った内容は保存する構造化データの「分析の前提(meta.assumptions)」に一覧で入れ、推定であることを明記する(利用者が見て直せるようにする)。以下を必ず用意する。
- 表記ゆれ:大文字小文字・カタカナ・スペース有無の候補(キーワード集計から除外する)
- 外部要因・外部要因の判定語:自社が原因でないネガの発生源(プラットフォームの仕様変更・凍結、天候、景気、原材料高騰など)と、それを見つけるための語。存在しない商材は「該当なし」と書き、そのセクションは0件と明記する
- ポジティブの評価語・ネガティブの評価語:業種に合わせて各10語程度(例:SaaS=便利・助かる・おすすめ・神・重宝/不具合・エラー・高い・使いにくい・解約、飲食=美味しい・また行きたい/まずい・待たされた、化粧品=肌に合う・リピート/肌が荒れた・合わなかった)
- 推定に自信がない項目は「推定(要確認)」と付ける。この設定と推定リストにない固有名を、保存データ内で勝手に使ってはならない

# 検索条件の読み取り(ファイル名から・必須)
添付CSVのファイル名には、検索に使ったキーワードと演算子、取得期間が含まれている。
例:`trends_posts_SocialDog_-from_SocialDog_JP_-is_retweet_2026-07-01_2026-07-31.csv`
→ キーワード「SocialDog」/`-from:SocialDog_JP`(自社の投稿を除外)/`-is:retweet`(リポストを除外)/期間 2026-07-01〜2026-07-31
- ファイル名を必ず読み取り、検索キーワード・除外条件・期間を`meta`にそのまま記載する。
- `_-from_〇〇` は「〇〇の投稿を除外した」という意味。**この指定がある場合、CSVに自社の投稿は含まれないので、全件を第三者のクチコミとして扱う**。
- `_-is_retweet` がある場合はリポスト除外済み。全件を分析母数とする。
- `-from` の指定がない場合は自社の投稿が混ざっている可能性があるので、その旨を`data_quality`に書く。
- ファイル名から読み取れない場合のみ、実データから条件を推定し、「推定」と明記する。

# 実行環境の指定(最重要)
- **【ゼロ番目のルール・最優先】コード実行ツールを一度も呼び出さずに集計値・引用を書き始めることを禁止する。可否は「宣言」ではなく「実行」で確認する:まずコード実行を1回呼び出し、添付CSVの読み込み(行数の表示まで)を試みる。**
- **「この環境ではコード実行ツールが使用できないため、正確な集計・データ保存ができません」と回答してよいのは、実際に呼び出してコード実行ツール自体が起動しなかった場合のみ。一度でもコードが動いた場合、この文言を使うことを禁止する。**
- **集計の途中でエラーが出た・応答が途切れた・ファイル保存に失敗した場合に「実行できない」と結論することを禁止する**。その場合は下の「実行の安定化」の手順で必ず再実行し、保存を完了させてから返答を終える。**保存が完了していない状態で作業を打ち切ってはならない。**
- 必ずコード実行(Python等)で添付CSVを実際に読み込み、集計すること。目視・推測で件数や指標を作ってはならない。
- CSVの文字コードはUTF-8(BOM付き)。`encoding="utf-8-sig"` で読み込む。
- 全件を対象に集計する(サンプリングで済ませない)。
- **総件数・ユニーク投稿者数・総インプレッションなどのKPI数値は、必ずコードで実際に計算した変数の値をそのまま保存データに書き込むこと。保存直前に、保存データ内のKPI数値と集計変数の値が一致しているかをコードで検算する。**

## 実行の安定化(途中でエラー停止しないための必須ルール)
- **集計からファイル保存までを1回の実行で完結させること(必須)。セル分割は禁止する**。コードが長くなる場合も、1つのスクリプトとしてまとめて一度に実行する(セルを分けるほど保存に到達する前に応答が途切れる)。
- **コードの並び順は「①集計 → ②検算 → ③示唆・問題点・アクションの生成 → ④ファイル保存 → ⑤保存したファイルを読み直して検算結果を表示」に固定する**。最後に必ず保存処理が実行される形にし、保存より後に重い処理を置かない。
- **途中経過の`print`は最小限にする**。`df.head()`・データフレーム全体・辞書全体・JSON本文の出力は禁止し、進捗確認は1行ずつの短いログのみ。出力が長いほど保存前に打ち切られる。
- **例外を握り潰さない**。`try/except`で失敗を隠して先に進めると、空の項目のまま保存されるため、エラーはそのまま表示して修正・再実行する。
- エラー時は失敗行だけを直さず、**スクリプト全体を先頭から実行し直す**。2回連続で途切れた場合は、示唆・アクションの文面生成を短くしてでも保存までを1回で終わらせる。
- 保存したファイルから読み直すときは、入れ子の辞書のキー名を先に確かめてから参照する。
- `for a, b in df.values` のような暗黙のアンパックは使わず、`df.iterrows()` で列名を指定して取り出す。
- **ファイルを書き出したら、必ず同じ返答の中でダウンロードできる形で提示して終わる**。会話が途切れると保存したファイルは消えるため、あとから提示し直すことはできない。
- **ファイルのダウンロード提示ができない実行環境の場合のみ**、`analysis_result_B.json`の全文をコードブロックで出力する(長い場合は複数回に分けて全文を出し切る)。このときも要約レポートや解説文は書かない。保存も提示もせずに終わることは禁止する。
- 最後の返答は「保存したファイル名・パス」と「ハードチェックの結果」だけにし、長い解説やレポート文面の下書きを書き足さない。

# 入力データ(SocialDog クチコミ推移のCSV/全21列)
1行=1投稿。
- 基本:投稿ID / 投稿日時 / SNSアカウント / 投稿の種類 / 投稿内容 / ユーザー名 / 表示名 / 投稿URL
- 反響:インプレッション / エンゲージメント / コメント・返信 / いいね / シェア・リポスト / 引用ポスト / 保存+各指標の「/ インプレッション」率

## 列の取り扱い(重要・必ず守る)
- **「いいね」列は「その投稿が獲得したいいね数」**であり、投稿者の累計ではない(キーワードモニターCSVとは意味が逆なので注意)。
- **リポスト行の反響指標は使ってはならない(最重要)**:「投稿の種類」が「リポスト」の行はインプレッションがほぼ0である一方、「シェア・リポスト」に元投稿の累計リポスト数が入り、エンゲージメントが異常に膨れ上がる。
  - **分析母数は「リポストを除いた投稿(通常投稿・フィード+返信)」とする**。リポストは「拡散の量」として件数・人数のみ`post_types`で扱い、ERの分子・分母に入れない。
  - `meta`に「総件数N件(うちリポストR件を除外した分析母数M件)」を保存する。リポストが0件の場合も「リポスト0件のため全件を分析母数とする」と明記する。
- **自社の投稿は分析対象外**:`-from:自社アカウント`で除外済みが前提。「自社発信 vs 第三者」の比較や自社のリーチ占有率は算出しない。
- **率列は信用せず、自前で再計算する**:分母(インプレッション)が0の行は率を計算せず、率の集計から除外する。除外件数を`data_quality`に明記する。
- **このCSVには投稿者のフォロワー数・プロフィール情報がない**。属性推定・ペルソナ分析・地域分析は行わず、`data_quality`に「本データでは測定不可」と注記する。
- 投稿内容には重複(リポスト元の本文)が含まれる。キーワード集計は重複を除いた上で行い、除いた件数を`data_quality`に明記する。

# 母数と指標の定義(必ずmetaに含める)
- 総件数/ユニーク投稿者数/収集期間(最小〜最大日時と日数)をコードで算出して保存。
- **収集期間が31日以内なら日別集計を主とする**。31日を超える場合のみ月別を主とし、日別はスパイク日top5〜10のみ保存する。
- 投稿の種類別(通常投稿・フィード/返信/リポスト)の件数と比率を必ず`post_types`に保存する。
- エンゲージメント率(ER)=エンゲージメント ÷ インプレッション。**合計÷合計の「全体ER」と、投稿ごとのERの中央値の両方を必ず`kpi`に保存する**。
- インプレッションは極端なロングテールになるので、平均値だけでなく中央値・四分位数・最大値を`kpi`または`impression_distribution`に保存する。
- **インプレッションが10未満の行は率(ER)の集計から除外する**。分母が極小の行は数百%のERになり、中央値ERを歪める(実例:インプレ2・エンゲージメント3の返信でER150%)。除外した件数と使った下限閾値を`data_quality`に明記する。
- ERが100%を超えるなど現実にあり得ない値が出た場合は、集計を停止して原因を特定してからやり直す。**原因をリポスト行の混入と決めつけず、①リポスト行の混入 ②インプレッションが極小(0〜数件)の行 ③CSVの率列をそのまま使っている の3つを順にコードで確認し、どれが原因だったかを`data_quality`に明記する**(リポストが0件でも分母極小で100%超は発生する)。

# 分析軸(すべてコード実行・structured dataに保存)
1. **拡散サマリー**:総インプレッション/総エンゲージメント/全体ER/中央値ER/ユニーク投稿者数 → `kpi`
2. **投稿の種類別**:件数・インプレ合計・中央値・ERを比較(リポスト行の指標は「参考値・使用不可」と明記) → `post_types`
3. **時系列**:日別の投稿数とインプレッションの推移データ、**インプレ上位のスパイク日top5とその日の要因投稿(原文+投稿URL)**を必ず保存 → `timeseries`
4. **バズ投稿ランキング top20**:インプレッション順。各要素は「日時/種類/原文抜粋/インプレ/エンゲージメント/ER/いいね/リポスト/返信/投稿ID/投稿URL」の11項目 → `buzz_posts_top20`
5. **ER上位ランキング top20**:**インプレ100以上の投稿に限定**し、その閾値を`meta`または`er_top20`内に明記する。項目はbuzz_posts_top20と同じ11項目 → `er_top20`
6. **反響の分布と集中度**:インプレ帯別(0 / 1〜99 / 100〜999 / 1,000〜9,999 / 10,000〜)の件数分布と、**上位10%の投稿が総インプレの何%を占めるか(パレート分析)** → `impression_distribution`
7. **エンゲージメントの内訳**:いいね/返信/リポスト/引用/保存の構成比、保存が多い代表投稿・引用が多い代表投稿(それぞれ正しい指標の実数を添える) → `engagement_breakdown`
8. **センチメント×リーチ**:各投稿を**ポジティブ/ネガティブ/ニュートラル/判定不能の4区分のうち必ず1つ**に分類し、件数と獲得インプレッション合計の両方を保存 → `sentiment_reach`
   - **「外部要因」は4区分とは別軸の独立フラグであり、5番目のカテゴリとして数えてはならない**。外部要因に該当する投稿も必ず4区分のいずれかに入れたうえで、外部要因セクションに件数・全体比・インプレ合計・代表投稿3件を別掲する(0件でも項目自体は保存)。
   - **判定不能の定義**:本文がURLのみ・定型の自動投稿・ブランド名の言及のみなど、評価が読み取れない投稿。「評価は読めるが中立」のニュートラルと混同しない。判定不能が0件になる場合は、その判定基準を`sentiment_reach`に明記する。
   - **4区分すべてについて「件数比%」と「リーチ比%(インプレ合計の構成比)」を並べて保存する**。件数比が小さい区分(例:判定不能)でもリーチ比が大きいケースがあるため、片方だけの保存を禁止する。
   - **評価語は2文字以上の語で登録する**。「楽」「神」のような1文字語は「楽天」「神奈川」などに誤マッチしてポジ判定を水増しするため単独使用を禁止し、「楽になった」「神ツール」のように語の形にする。誤マッチしやすい語には除外条件(例:「楽天」を含む場合は数えない)を付ける。
   - **外部要因の判定語に「X」「Twitter」などのプラットフォーム名単独を使ってはならない**(本データはほぼ全件が該当してしまう)。「仕様変更」「API制限」「凍結」「シャドウバン」「障害」「規約変更」など現象を表す語で判定する。
   - **ネガティブが分析母数の3%未満、またはポジティブが50%超になった場合は、辞書の取りこぼしを疑って一度だけ再点検する**:インプレッション上位50件と「返信」種別の本文を目視で確認し、辞書にない否定表現(「できない」「反映されない」「思ってたのと違う」「値上げ」など)を追加して再集計する。
   - **ポジ比率・ネガ比率が想定レンジに入らないことを理由に、判定をやり直して比率をレンジ内に寄せてはならない**。上記の再点検をしても比率が変わらない場合は、使用した評価語の全一覧と「レンジ外である理由」を`sentiment_reach`に明記してそのまま継続する。「使ってる」のような評価を含まない語をポジに数えることを禁止する。
9. **関連キーワード×リーチ**:頻出語top20を文書頻度で抽出し、語ごとの「含む投稿数」と「平均インプレッション」を保存。「言及は少ないが伸びる語」(含む投稿数3件以上かつ平均インプレッションが全体平均を上回る語)を3語以上抽出。ハッシュタグtop10も別集計 → `keywords_reach`
10. **投稿者別の貢献度**:ユーザー別の投稿数とインプレ合計top10、上位1人が総リーチの何%を占めるか → `contributor_concentration`
   - **「上位1人の占有率」は「そのユーザーの全投稿のインプレ合計 ÷ 総インプレッション」で計算する**。単一投稿の最大インプレッションを占有率として使ってはならない(別物であり、混同すると`issues`の記述と数値が食い違う)。占有率とあわせて、その投稿者の投稿数も必ず保存する。
11. **時間帯・曜日別**:投稿数と平均インプレの数値表(件数5未満のセルは参考値と明記) → `time_heatmap`

## 引用の絶対ルール(保存データ全体に適用)
- 引用文はCSVの「投稿内容」列を**一字一句そのままコピー**する。要約・整文・言い換え・創作は禁止。長すぎる場合のみ末尾を「…」で省略してよい。
- 引用は必ずコード実行で該当行を抽出し、根拠として「投稿ID」と「投稿URL」を併記する。
- 引用には必ずその投稿のインプレッション・エンゲージメントを添える。
- 投稿URL・引用文・投稿IDは、`df`から実際に取得した「同じ1行」の値をセットで使う(異なる行からの組み合わせを禁止)。保存直前に、埋め込んだ全ての投稿URL・投稿IDが元CSVに実在するかをコードで検証し、不一致があれば削除するか実在データに差し替える。
- 異なる項目(バズ投稿、ER上位、外部要因の代表例、伸びる投稿パターンの代表例など)の代表投稿として、同一の投稿URL・引用文を複数箇所で使い回してはならない。1つの「使用済み投稿URL」リストを保持し、保存直前に重複がないか検算する。
- **代表投稿を選ぶ関数の引数デフォルト値に`set()`などの可変オブジェクトを使わない**(使用済みリストが正しく共有されず重複が発生する)。使用済みを除いた候補が0件になった場合は、`df.head()`のような無関係な行にフォールバックせず「該当なし」と明記する。

# データ保存仕様(この工程の最終成果物)
- 出力ファイル:`analysis_result_B.json`(UTF-8、`ensure_ascii=False`、インデント付き)を必須とする。**ファイル名は必ず`analysis_result_B.json`とし、`analysis_result.json`のような汎用名で保存してはならない**(キーワードモニター分析のプロンプトA-1が`analysis_result_A.json`を保存するため、同じチャット・同じ作業フォルダで両方を実行しても上書きされないようにする)。バズ投稿一覧などの表形式データは補助CSVでも書き出してよいが、正本はJSONとする。
- JSONの主要キー構成(後段のプロンプトB-2はこのJSONだけを読んでHTMLレポートを作るため、ここに存在しない情報はレポートに出せない):
  - `meta`:対象ブランド名、業種、ファイル名から読み取った検索条件(キーワード・除外条件・期間)、総件数、分析母数(リポスト除外後)、ユニーク投稿者数、収集期間(開始・終了・日数)、分析の前提(推定した項目一覧)
  - `kpi`:総インプレッション/分析対象投稿数/ユニーク投稿者数/全体ER/中央値ER/ポジ比率、インプレッションの平均・中央値・四分位数・最大値
  - `post_types`:投稿の種類別(通常投稿・返信・リポスト)の件数・インプレ合計・中央値・ER
  - `timeseries`:日別または月別の投稿数×インプレッション推移、スパイク日top5〜10と要因投稿
  - `buzz_posts_top20`:20件、各11項目
  - `er_top20`:20件、各11項目、絞り込み閾値の明記
  - `impression_distribution`:帯別件数分布、パレート分析(上位10%シェア)
  - `engagement_breakdown`:いいね/返信/リポスト/引用/保存の構成比、代表投稿2件(保存代表・引用代表)
  - `sentiment_reach`:4区分の件数とインプレ合計、外部要因セクション(件数・全体比・インプレ合計・代表投稿3件)、判定に使った評価語一覧と件数
  - `keywords_reach`:top20(文書頻度・平均インプレ)、伸びる語3語以上、ハッシュタグtop10、除外したストップワード一覧
  - `contributor_concentration`:投稿者別top10、上位1人の総リーチ占有率
  - `time_heatmap`:時間帯・曜日別の投稿数と平均インプレの数値表
  - `data_quality`:ファイル名から読み取った検索条件、リポスト除外件数・理由、分母0除外件数、投稿者属性が取れない制約、使用辞書・閾値
  - `marketing_suggestions`:伸びた投稿パターン4以上(件数・平均インプレ・代表投稿)、拡散起点の投稿者タイプ、施策(今すぐ3件以上/中長期3件以上)
  - `issues`:5〜7件、各【問題】【根拠】【深刻度】【影響】。次の5観点を各1件以上カバー:リーチの集中/届いていないクチコミ/ネガの拡散力/エンゲージメントの質/データ品質起因のリスク
  - `action_plan`:6件以上、各8項目(アクション名/対応する問題点/優先度/想定担当/難易度/期待効果/KPI/実行時期)、クイックウィンフラグ、優先度P1・P3各3件以上
- **保存直前のハードチェック(アサーション必須)**:以下を1つでも満たさない場合、理由だけを書いて済ませず、不足分をコードで埋めてから保存する。
  - 上記の全キーがJSONに存在する
  - `buzz_posts_top20` と `er_top20` の要素数がそれぞれ20(不足時は理由と実際の件数を明記)、各要素に11項目すべてが存在する
  - `sentiment_reach`の**4区分(ポジ・ネガ・ニュートラル・判定不能)の件数合計が分析母数と一致**し、**4区分のインプレ合計が総インプレッションと一致**する(外部要因は別軸のため4区分の合計に含めない)
  - `engagement_breakdown`のいいね/返信/リポスト/引用/保存の件数合計が総エンゲージメントと一致する
  - `issues`・`action_plan`・`marketing_suggestions`の文中に現れるすべての数値が集計変数の値と一致する(数字を文字列リテラルで直書きしていないことを確認する)
  - `keywords_reach.top20`の要素数が20、伸びる語が3語以上
  - `issues`の要素数が5以上、各要素が4フィールドすべて埋まっている
  - `action_plan`の要素数が6以上、各要素が8フィールドすべて埋まっている、P1・P3が各3件以上
  - `marketing_suggestions`の伸びた投稿パターンが4以上、施策が今すぐ3件以上・中長期3件以上
- 保存が完了したら、チャットの返答は「保存したファイル名・パス」と「上記ハードチェックの結果」のみを簡潔に述べて終える。レポート文面の下書きや長い解説を書き足さない。

# 実行前チェック(過去に実際に起きた事故・必ず回避する)
1. コードを実行できたのに、最後に「コード実行ツールが使用できない」と結論して終わる → 一度でも動いたらこの結論は禁止。
2. セルを細かく分けた結果、`analysis_result_B.json`の保存処理に到達せず終了する → 1回の実行で保存まで完結させる。
3. 問題点・アクションの文章に、集計していない数字を手で書く → すべてf-stringで変数から埋め込む。
4. 「外部要因」を4区分の1つとして数え、「判定不能」を作らない → 4区分+外部要因フラグ(別軸)にする。
5. 代表投稿の使い回し、または候補ゼロ時に無関係な行へフォールバックする → 使用済みリストで管理し、無ければ「該当なし」。
6. 重複本文(同一本文の再投稿)を除かずにキーワード集計する → 重複除去件数を`data_quality`に明記する。

# 制約
- 個人を特定・名指ししない(原文引用時はアカウント名を伏せる)
- **リポスト行の反響指標を集計に使ってはならない**。除外した件数と理由を必ず`data_quality`に明記する
- 分母が0の行で率を計算しない。平均値だけでなく中央値を併記する
- **比率は必ず分母を明示し、保存データ全体で統一する**
- **センチメント4区分の件数合計は分析母数と、インプレ合計は総インプレッションと必ず一致させる**
- 件数は整数で保存する(「4.0件」のような小数表記は禁止)
- **キー名・ラベルは日本語にする**(calc_ER・is_company のような内部変数名をそのまま保存しない)
- **示唆・考察・問題点・アクションに書く数値もすべてコード実測値を使う**(概算・印象値を書いてはならない)
- **`issues`・`action_plan`・`marketing_suggestions`の文章に数字を直接タイプすることを禁止する**。必ず`f"...{変数}..."`の形で集計変数から埋め込む。文字列リテラルに数値を書いた時点で捏造とみなす(実例:上位1人の占有率は実測62.5%なのに「59.9%」、いいね構成比は実測77.9%なのに「95.99%」と書かれる事故が起きている)
- **伸びた投稿パターンは互いに重複しない条件で作り、該当0件のパターンを無理に作らない**(作れない場合はパターン数と理由を明記する)。条件に合う投稿がないときに`df.head()`など無関係な行を代表投稿に使うことを禁止する
- **ストップワードは指示した語だけを除外する**。無料・ツール・投稿・予約投稿など、その商材の評価に直結する語を勝手に除外語へ追加してはならない
- **同じ投稿を複数パターンの代表に使わない**
- このCSVにない情報(フォロワー数・属性・地域)を推測で補わない
- 数値はすべてコード実行による実測に基づく。憶測値・造語カテゴリ・存在しない列の使用は禁止
- 引用は原文コピーのみ。要約・創作した引用文を保存することは禁止
- 指定した件数・項目を省略しない。省略する場合は理由を明記する
- 保存するJSON内のテキスト値は日本語(常用漢字)で統一する。簡体字・繁体字を混在させない
- 成果物は単一JSONファイル(+任意の補助CSV)として完結させる
3. Step 3: Input Prompt ② into the AI to generate an HTML report [Prompt]
Next, send Prompt ② (HTML report generation version). Once this process is complete, an HTML report summarizing the results in graphs and tables will be generated.
Show full prompt (Click to expand/collapse)
# Role
You are an expert in data visualization and report creation. Load the structured data (JSON file, and auxiliary CSV if necessary) that has already been aggregated, classified, and verified by "Prompt B-1 (Data Aggregation/Saved Version)," and generate a single HTML report (.html) according to the specified structure.
**Do not perform any aggregation, classification, recalculation, or estimation in this step. Focus solely on placing the values present in the input file into the report. Creating new values, quotes, or URLs not present in the input file is prohibited as fabrication, even if the result looks polished.**

# Input File Specifications
- The input is `analysis_result_B.json` (and auxiliary CSV if needed) saved by "Prompt B-1." The user will attach this file. If the filename is different, such as `analysis_result.json`, it may still be used as long as it is the conversation trends analysis JSON output by Prompt B-1 (containing the main keys listed below).
- If the attachment is missing, there are multiple files, or the main JSON keys (meta / kpi / post_types / timeseries / buzz_posts_top20 / er_top20 / impression_distribution / engagement_breakdown / sentiment_reach / keywords_reach / contributor_concentration / time_heatmap / data_quality / marketing_suggestions / issues / action_plan) are clearly missing, ask the user "which file to use" or "if Prompt B-1 needs to be re-run" before starting report creation. **Do not estimate, calculate, or create missing data in this step without confirmation.**
- If only some keys are missing (but the overall file is usable), you may continue report creation, but display a note such as "Insufficient input data: [Key Name] (Please re-run Prompt B-1)" in the corresponding section/item without drawing values or graphs. **Filling in missing values through estimation or calculation is prohibited.**

# Execution Environment Specifications (Most Important)
- **[Rule Zero / Top Priority] Do not start writing HTML content (values, quotes, URLs) without calling the code execution tool at least once. First, check if code execution (Python environment) is available in this conversation. If not, do not generate the report and simply reply, "HTML cannot be generated because the code execution tool is unavailable in this environment," and end the session.**
- Always use code execution (Python) to actually load the input JSON using `json.load()`, etc., and build the HTML using only those values. Do not write values or text based on visual inspection, estimation, or memory.
- **Do not transform values, strings, or URLs in the input JSON beyond rounding, paraphrasing, summarizing, or translating (only visual formatting like adding commas for digit grouping is allowed). Do not redo aggregation, reclassify, or perform new threshold judgments.**
- Use code to verify that post URLs, quotes, and values embedded in the HTML are actual values existing in the input JSON (e.g., `assert item["url"] in [p["url"] for p in data["buzz_posts_top20"]]`).
- Do not generate HTML all at once using f-strings (to avoid conflicts with CSS curly braces). Place CSS in a normal string variable and concatenate, ensuring values are finalized as variables before embedding.

## Stabilizing Execution (Mandatory Rules to Prevent Errors / Top Priority)
- **The structure of the input JSON is fully defined by the "Prompt B-1" data storage specification. Do not execute any print or confirmation cells just to check the structure.** Start writing the HTML construction process directly from the first code block.
- **You must execute the process from JSON loading to HTML output in a single code cell (Mandatory. Splitting is generally prohibited).** Do not proceed by executing and checking section by section. Perform all operational checks internally and only present one complete code block executed from start to finish to the user.
  - **A "single code cell" here refers to the number of times the code execution tool is called. Iteratively calling the tool to check structure, prototype sections, or adjust graph rendering is strictly prohibited. If there is anything you want to verify, consider it only within your reasoning without calling the tool. Once decided, pass a single code block written from start to finish to the tool for execution exactly once.**
- Only if splitting is absolutely necessary due to technical constraints, limit it to two blocks: "1. JSON loading & generation of sections 1–7" and "2. Generation of sections 8–16, HTML merging, & saving." **Redefine all necessary variables, including re-loading the input JSON, at the beginning of each block.**
- If an error occurs, do not just fix the failed part and move on. **Restart the entire block (or the entire code if not split) from the beginning** to ensure all variables used thereafter are defined.
- **Once the HTML is written, always present that HTML in the same response.** If the conversation is interrupted, the saved file will be lost and cannot be re-presented later. The final response should only present the HTML without lengthy explanations.
- **If the response is cut off, ends with irrelevant statements (including apologies or boilerplate like "I am learning"), or starts executing code in many small fragments, stop immediately and restart from the beginning, combining HTML construction and output into a single cell. Ending the conversation without presenting the final HTML at least once after failing this self-correction is strictly prohibited.**

# HTML Report Specifications
- Complete as a single .html file. Ensure all content is viewable by opening one file.
- Render graphs as inline SVGs (bar, pie, horizontal bar, dual-axis graphs). Do not rely on external CDNs or files. Prioritize well-formatted tables over broken graphs.
- Use a dashboard-style layout with responsive design, English fonts, and card UI to convey key points at a glance.

# HTML Structure (Section Order & Corresponding JSON Keys)
1. Header / Executive Summary: A one-sentence conclusion from `meta` and `kpi` + 3 main highlights. Clearly state collection conditions, population size, and exclusion of reposts (Creation of new conclusions is prohibited; limit to summarizing `issues` and `marketing_suggestions`).
2. KPI Cards: All items from `kpi` (Total impressions / Number of analyzed posts / Unique contributors / Overall ER / Median ER / Positive ratio). **All items mandatory. No blanks or hyphens.**
3. Time Series: Daily post count × impression trends from `timeseries` + factor posts for spike days (**Link factor posts only to the day they were posted using post IDs. Do not mix posts from different days**).
4. Top 20 Buzz Posts: All 20 items from `buzz_posts_top20` (Original text + all metrics + post URL).
5. Top 20 ER: All 20 items from `er_top20`.
6. Response Distribution and Concentration: Pareto chart from `impression_distribution`.
7. Engagement Breakdown: From `engagement_breakdown`.
8. Sentiment × Reach: 4 categories from `sentiment_reach`. **Display both volume % and reach % side-by-side.**
9. External Factors: External factor items from `sentiment_reach`. Volume, percentage of total, total impressions, and 3 representative posts. **Even if 0, clearly state "0" and do not remove the section.**
10. Related Keywords × Reach: Top 20 from `keywords_reach`, trending words, and top 10 hashtags.
11. Contributor Contribution: From `contributor_concentration`.
12. By Time/Day: Numerical table from `time_heatmap`. **Output both "Number of posts" and "Average impressions" in the table.**
13. Data Quality Notes: All items from `data_quality`.
14. Marketing/Sales Implications: `marketing_suggestions`. 4+ high-performing post patterns, 3+ immediate and 3+ long-term measures each.
15. Issues: All items from `issues`, each with [Issue], [Evidence], [Severity], and [Impact].
16. Action Plan: All items from `action_plan` in an 8-column table, highlighting 3 Quick Wins at the beginning.
- **The report must consist of 16 sections, numbered sequentially from 1 to 16. External Factors must be counted as an independent Section 9; do not use sub-numbers like "8-2" (and do not skip numbers).**

# Pre-output Check (Assertions Mandatory)
Immediately before outputting the HTML, perform assertion checks for all of the following using code. If any are not met, add or fix the section before outputting (do not just explain the reason).
- All section headings 1–16 exist in the generated HTML string (Verify sequential numbering 1–16 without sub-numbers).
- The number of rows in the Top 20 Buzz Posts section matches `len(data["buzz_posts_top20"])`.
- The number of rows in the Top 20 ER section matches `len(data["er_top20"])`.
- All 4 categories exist in Sentiment × Reach (Section 8), with both volume % and reach % for each. External Factors exists as an independent Section 9.
- All three items (Top 20, trending words, Top 10 hashtags) exist in the Related Keywords section.
- The number of items in the Issues section matches `len(data["issues"])`.
- The number of rows in the Action Plan table matches `len(data["action_plan"])`, and all 8 columns are displayed.

# Constraints
- Do not identify or name individuals (mask account names when quoting original text. This should already be handled in the input JSON, but do not add identifying information here).
- Do not create values, categories, quotes, or URLs not in the input JSON. If a value is missing, clearly state "Insufficient input data" and do not leave it blank.
- Display counts as integers (no decimals like "4.0").
- Use English for table column headings.
- Use English for all headings and body text in the output HTML. Avoid mixing different language variants.
- The final product must be a single, self-contained HTML file."}]```
Download the HTML and open it in your browser to instantly view a dashboard visualizing how conversations are spreading.
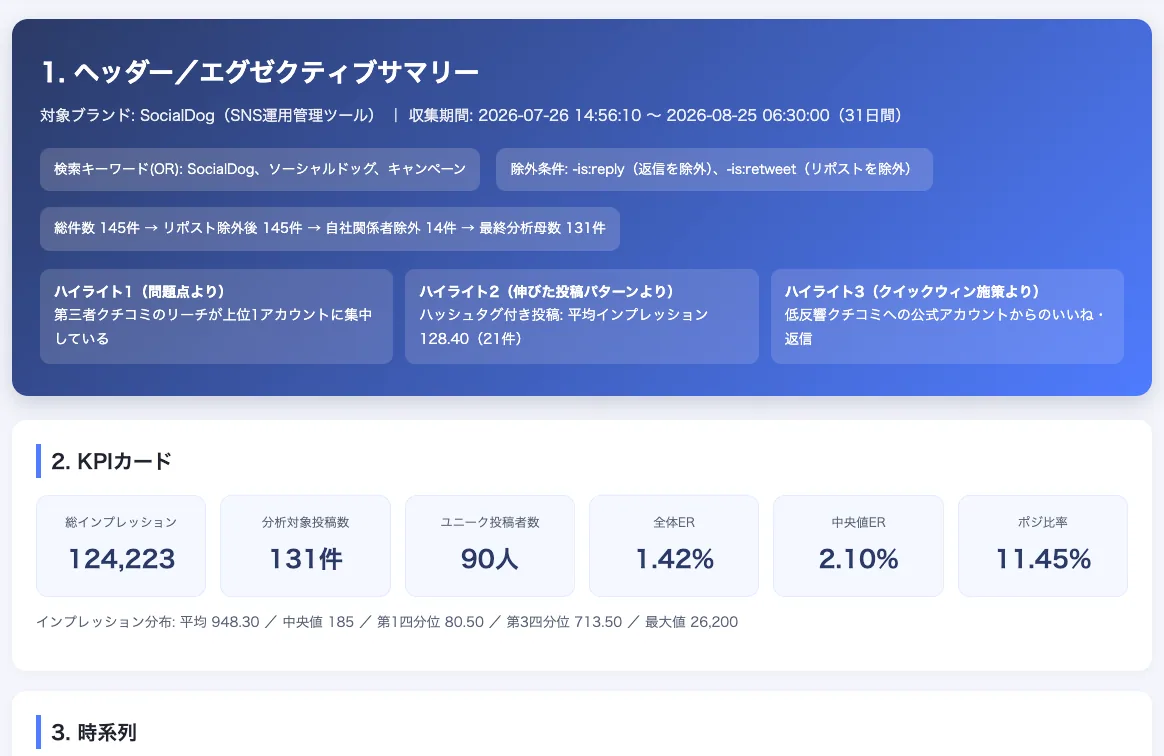
The report primarily includes the following:
- Executive summary / KPI cards (total impressions, number of analyzed posts, unique authors, overall ER, median ER, positive sentiment ratio, etc.)
- Time-series response trends (spike dates and the posts that caused them)
- Top 20 viral posts / Top 20 ER posts
- Distribution and concentration of responses (what percentage of reach is driven by top posts)
- Engagement breakdown (likes, replies, reposts, quotes, saves)
- Sentiment x Reach (how much negative conversation is spreading) / Isolation of external factors
- Related keywords x Reach (words with few mentions but high growth)
- Contribution by author (checking if spread depends on specific accounts) / By time and day of the week
- Issue identification and prioritized action plans
Since it's all on a single page, you can use it as-is for internal sharing or strategy planning. By visualizing "which conversations are reaching how many people," it serves as a starting point for identifying high-growth posting patterns or exploring how to leverage UGC.
4. Key points to keep in mind during operation
While we have set detailed verification rules for the prompts, we do not recommend taking AI-generated results at face value. Please check the following points when using them.
- Check the verification results displayed after step ①; if there are errors or incomplete items, re-run step ① instead of proceeding to step ②.
- Response metrics for repost rows (impressions, engagement, etc.) are not included in the totals. Reposts are handled in a separate section by count only.
- Posts with extremely low impressions are excluded from engagement rate calculations. Both average and median values are provided, so please check both.
- Since this CSV file does not include author follower counts or profile information, attribute estimation and persona analysis are not performed. If you want to know who is talking, please refer to Article 1.
- This assumes you have excluded your own posts during the search (-from:your_account). If not excluded, your own posts will be mixed in, which may change the analysis results.
- Do not use the data to identify individuals; treat it as aggregate data and trends.
5. Summary
By collecting conversation response data with SocialDog's "Conversation trends" and running prompts 1 and 2 in order, you can easily visualize the "reality of reach," which was previously difficult to track manually.
The generated HTML report covers everything from identifying characteristics of high-growth posts to discovering issues and creating specific action plans, making it ideal for reviewing campaigns and preparing for your next post.
Furthermore, if you want to see what is being said in those conversations, complete your analysis by also following Article 1: "Analyze your brand's conversations with SocialDog × AI (Who & What edition)" which uses "Keyword Monitor."
We hope you find this useful.
For detailed instructions on Conversation trends, please see Analyze user-generated content (UGC).