- Analytics are available only for X and Instagram.
- Analytics features are available only on the Professional, Business, and Enterprise plans. Please check the pricing page for details.
This section covers how to analyze follower growth and posts on X. For details on Instagram analytics, please refer to the Instagram article under Analytics.
Track follower acquisition results
Monitor follower changes
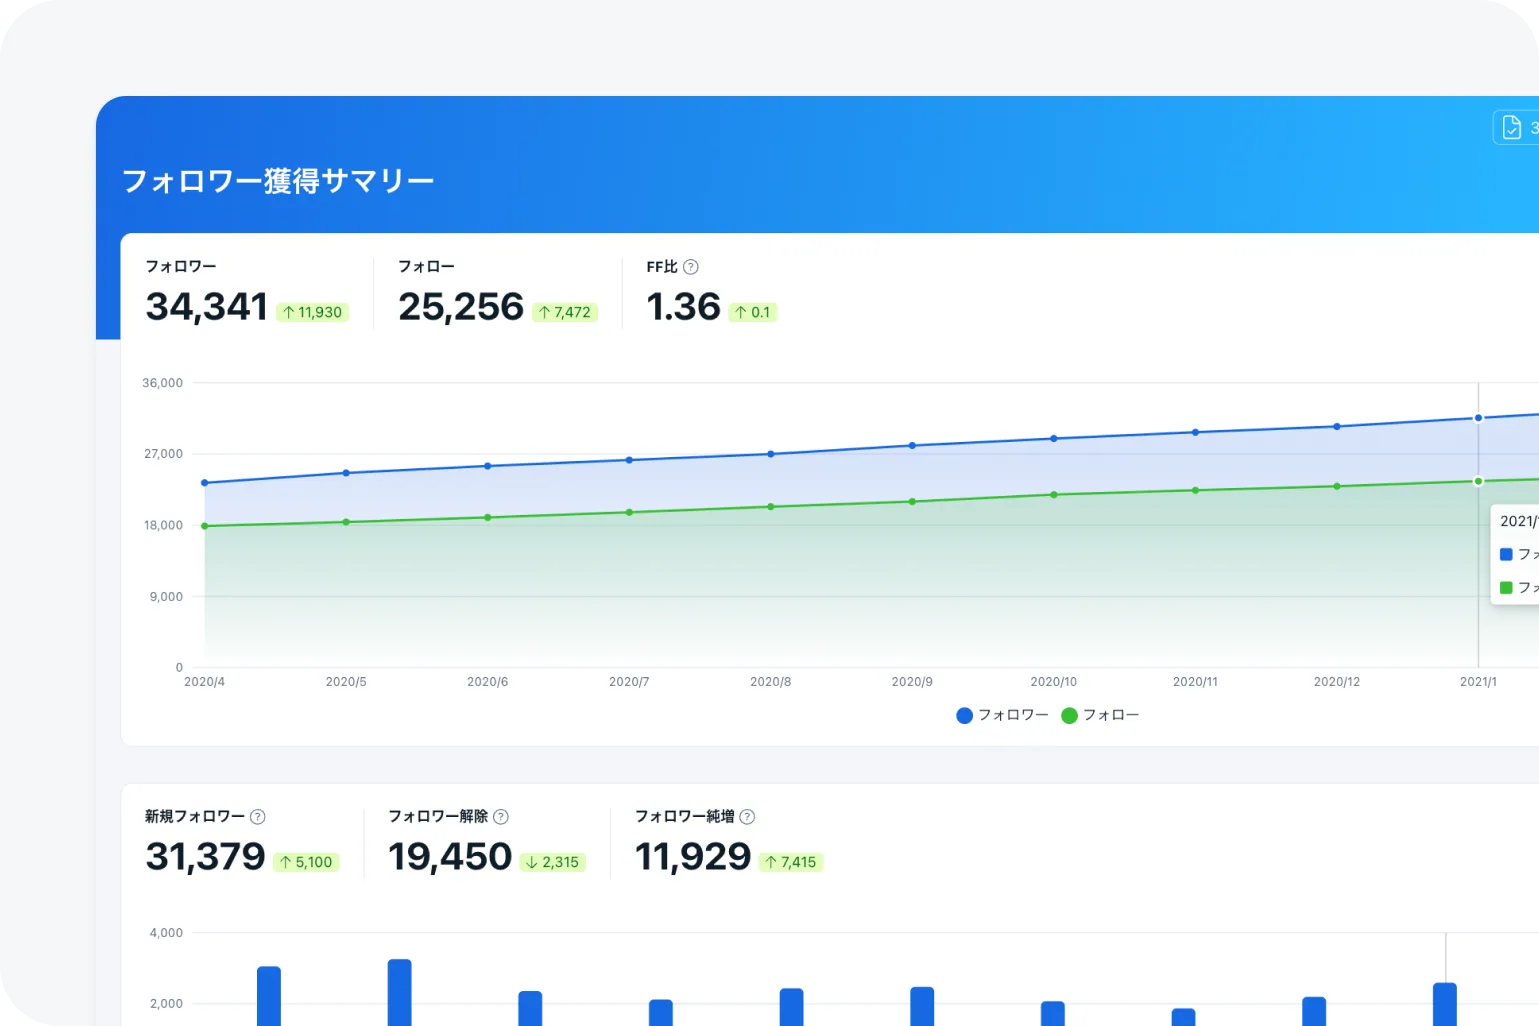
In the Acquisition overview or Followers section, you can check New followers, Unfollows, and Net follower growth by day, week, or month.
Identify trends in posts and actions that drive follower growth by reviewing recent posts from periods of high growth, and use these insights for future posts.
- Click Analytics in the menu.
- Select a time period in the top right as needed.
- Click Acquisition overview or Followers.
Check follower retention rate
In the Acquisition overview section, you can check the Follower retention rate by week, month, or year.
If users unfollow shortly after following, you won't achieve long-term growth. Identify periods with high unfollow rates and develop improvement strategies based on recent posts and actions.
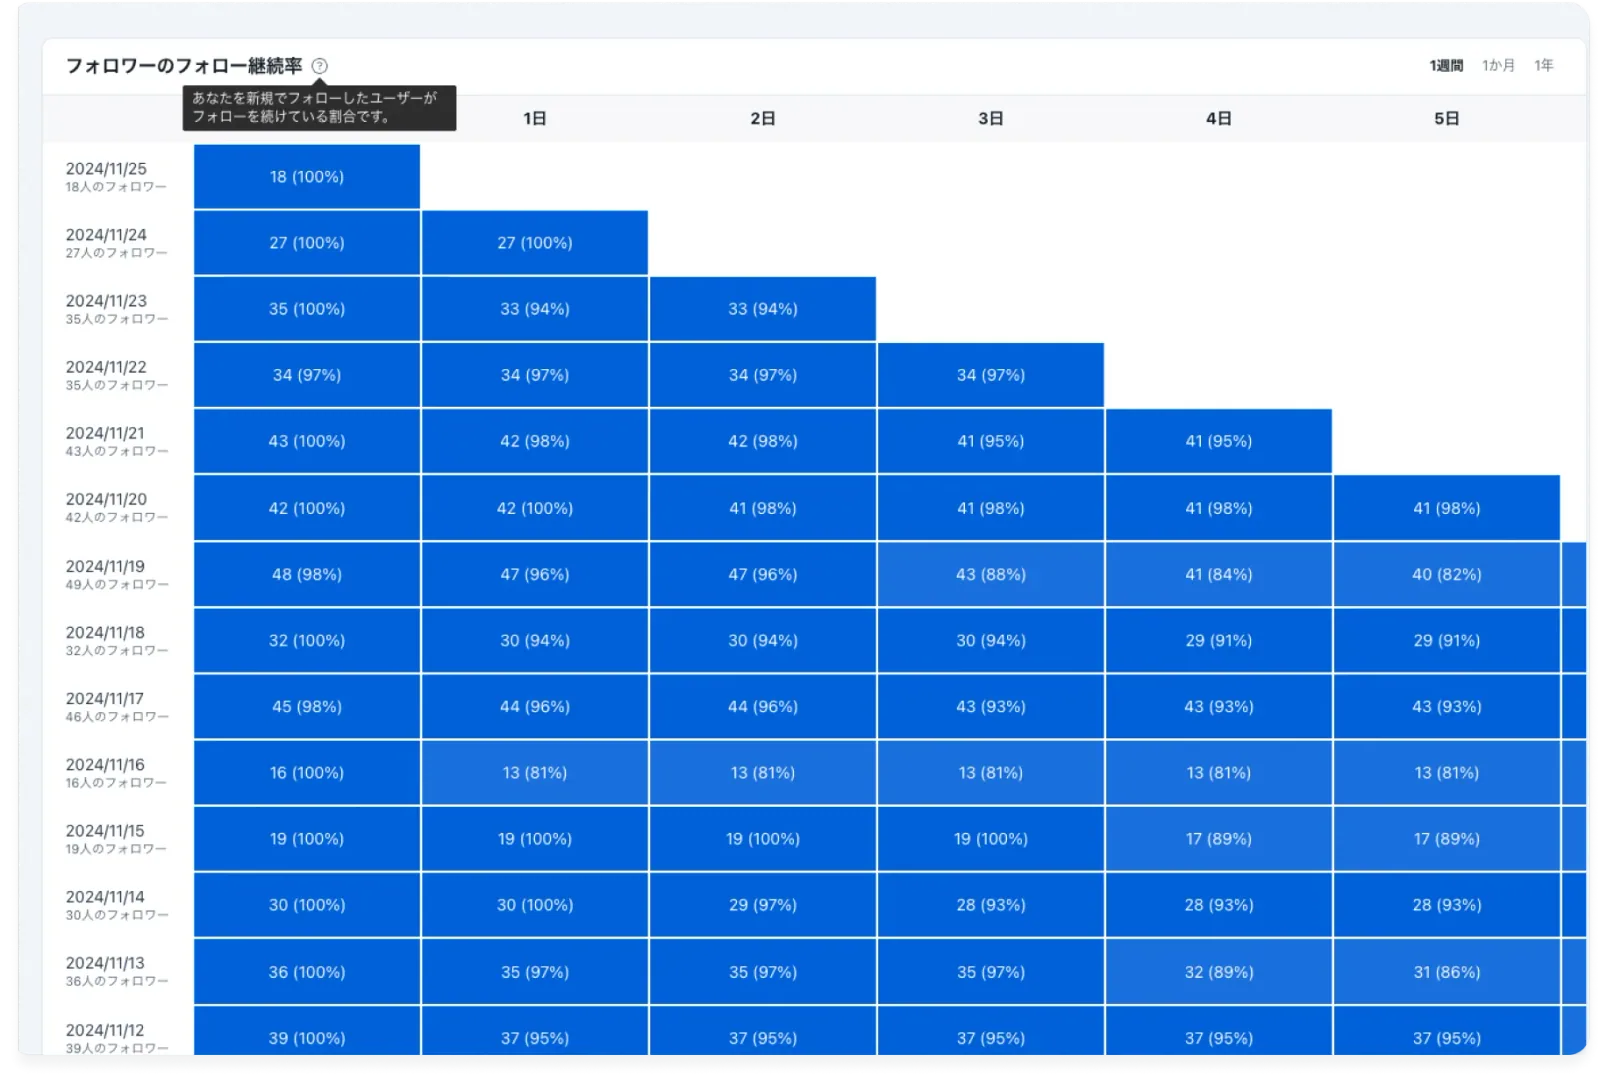
- Click Analytics in the menu.
- Click Acquisition overview.
- Select a period (1 week, 1 month, or 1 year) in the top right.
- The aggregation period for Follower acquisition analysis is limited to 1 week. To view data for 1 month or 1 year, please check the Acquisition overview.
Analyze to improve your X operations
This section is available only on the Business and Enterprise plans.
For the Professional plan, you can view a general overview in the Post overview.
Identify peak engagement times
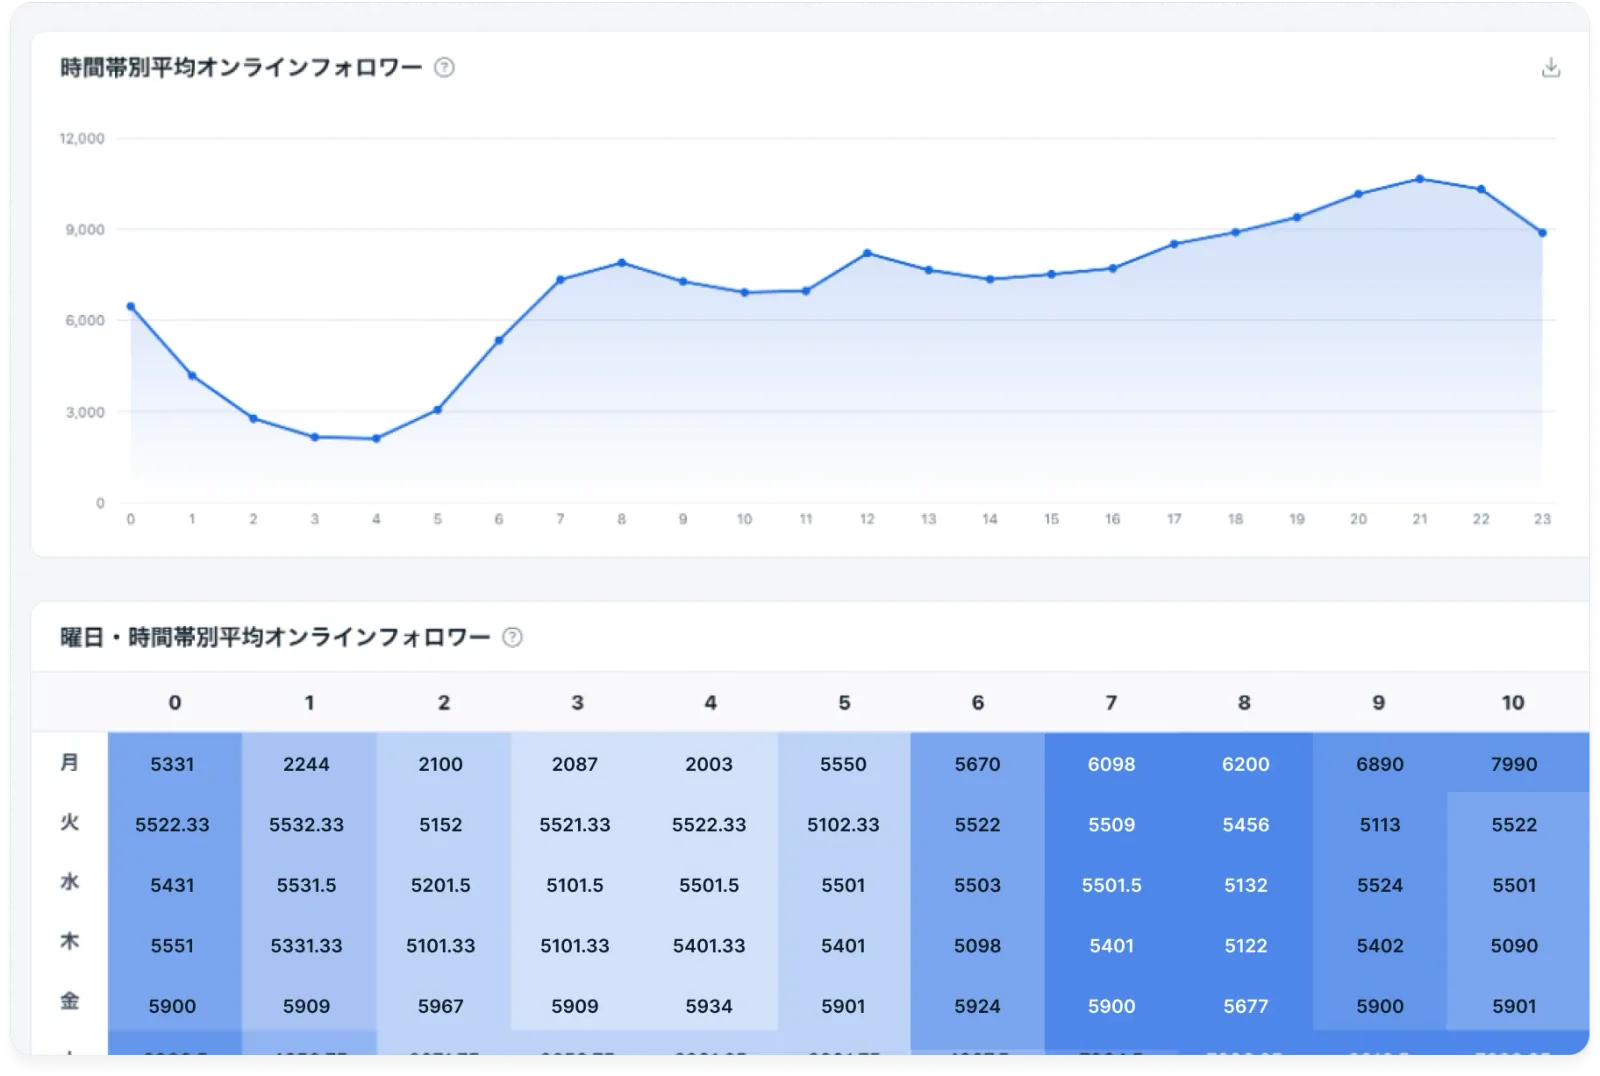
In the By time of day section of Analytics, you can check engagement by the time of day you posted.
To maximize engagement efficiently, identify peak engagement times and optimize your posting schedule.
- Click Analytics in the menu.
- Select a time period in the top right as needed.
- Click By time of day.
The Posts by time of day section shows the total number of posts, replies, reposts, and likes for each hour. Consequently, engagement tends to be higher during hours with more posts.
The Average engagement by time of day section shows the average engagement for each hour. This allows you to see typical engagement levels even if the number of posts varies by time.
Check engagement for media and hashtags
In the Media section of Analytics, you can check engagement by media type, such as images, videos, GIFs, or no media.
In the example below, you can see that posts with images receive higher engagement than those without media.
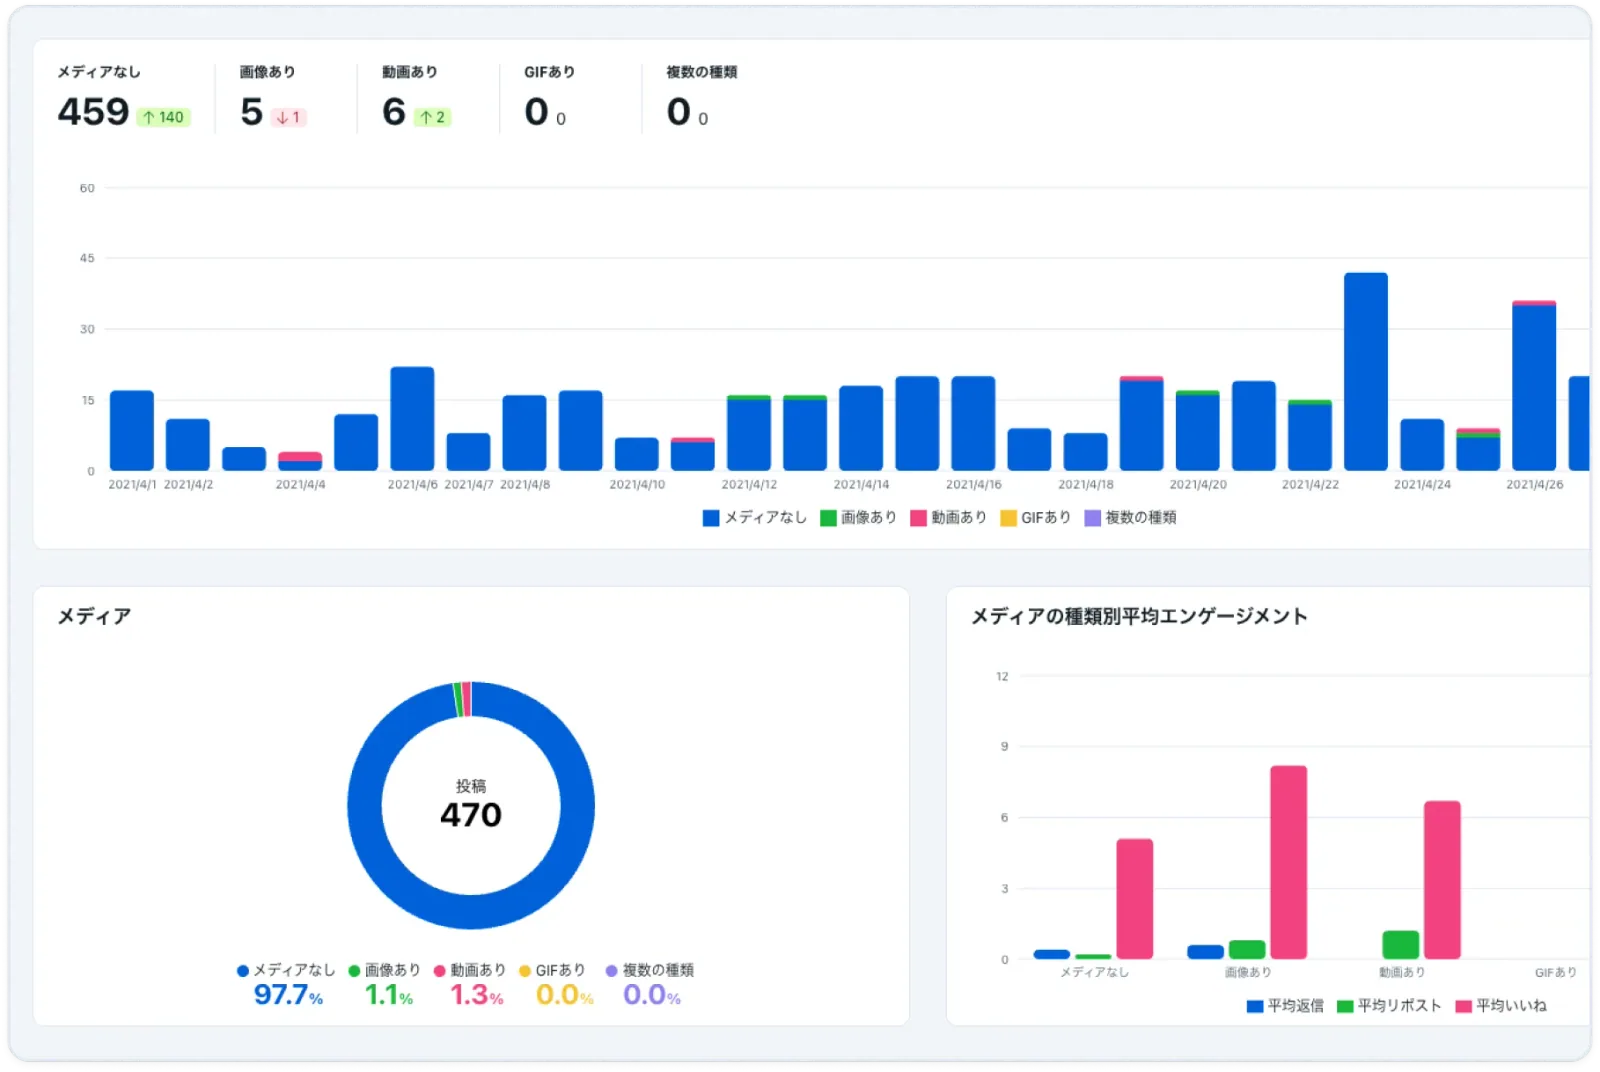
- Click Analytics in the menu.
- Select a time period in the top right as needed.
- Click Media.
In the Hashtags section, you can check engagement based on the presence and content of hashtags.
- Click Analytics in the menu.
- Select a time period in the top right as needed.
- Click Media or Hashtags.
Identify high-engagement posts
In the Engagement section of Analytics, you can view a list of posts with high engagement.
Identify trends in high-engagement posts and use these insights for your future content.
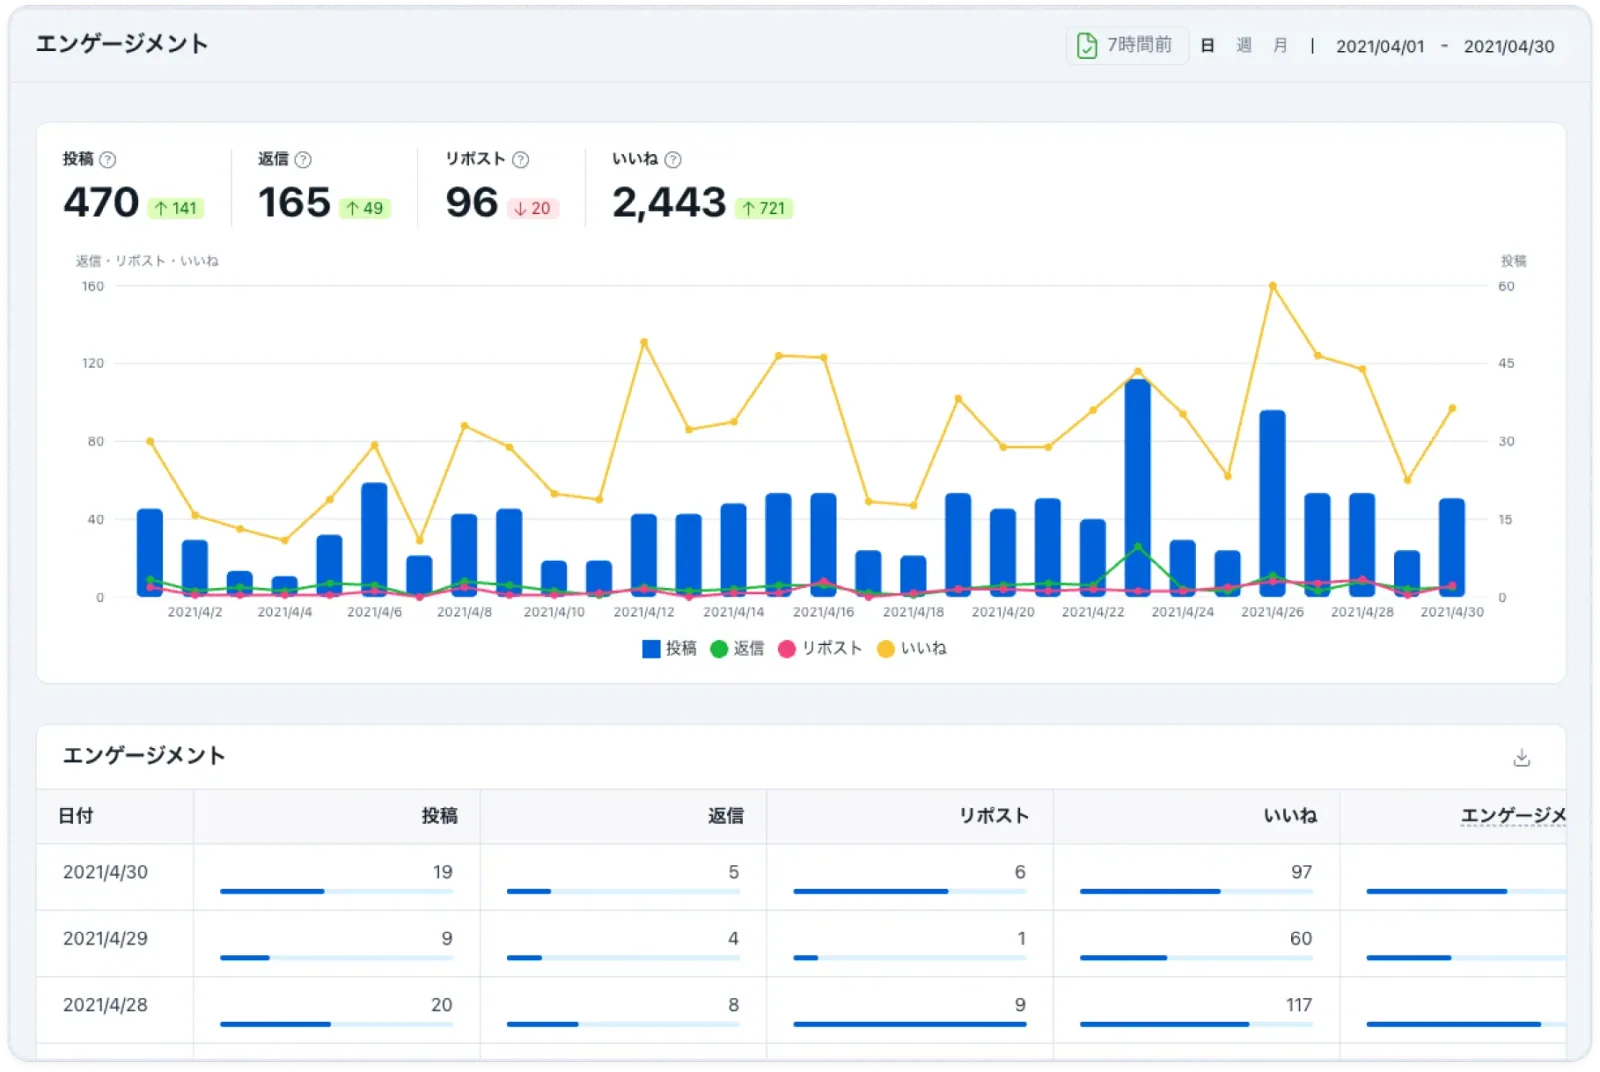
- Click Analytics in the menu.
- Select a time period in the top right as needed.
- Click Engagement.